All you need to now about scale-up and scale down, overflow metabolism and glucose feeding when using Escherichia coli as a process tool.
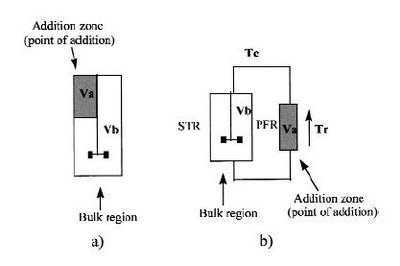
 Figure 1. Experimental set-up for scale-down simulation studies. (a) Large-scale STR. Va is the addition zone where the most extreme concentration gradients are known to exist and Vb is the bulk region that can be considered to be well mixed. (b) Scale-down simulation equipment. Here Va is represented by a 0.544-L PFR and Vb is represented by a 4-L STR.
Bioprocess Engineering Considerations
The salient feature of the fed-batch fermentation process is the continuous feed of a growth-limiting substrate, usually the carbon source, characterized by an ever-increasing level of energy limitation and an ever-decreasing specific growth rate. This feeding protocol avoids problems associated with catabolic regulation, oxygen limitation, and heat generation that can occur during unlimited batch processes (Minihane and Brown, 1986). Importantly, the build-up of toxic concentrations of metabolic byproducts via so-called “overflow” metabolic routes can also be avoided. Overflow metabolism has been reported for Saccharomyces sp. (George et al., 1993) and Escherichia coli.
For E. coli, an accumulation of an inhibitory concentration of acetic acid occurs via the redirection of acetyl-coenzyme A (CoA) from the Krebs cycle, during fast aerobic growth when a rapidly metabolizable carbon source, such as glucose, is available in excess (Andersson, 1996). In batch fermentation, overflow metabolism can be avoided by the use of a slowly metabolizable carbon source such as glycerol (Elsworth et al., 1968), but the preferred method used by industry (BioGaia AB, Sweden and Pharmacia, Sweden) for increasing the volumetric productivity of such bacterial products as amino acids (Forberg and Haggstrom, 1987) and high-value recombinant proteins (Riesenberg and Schulz, 1991) is the fed-batch strategy (see Lee [1996] for a comprehensive review).
However, problems still arise in the scale-up of such processes in that the production scale often does not give the same performance as the bench scale. There are many possible reasons for this difference and, in this study, flow cytometry is used to highlight a difference that has not been shown previously.
Scale-up is usually the final step in a research and development program leading to the large-scale synthesis of microbial products by fermentation (Einsele, 1978). It is known that chemical gradients exist in large-scale bioreactors (Xu, 1999) where additions of a concentrated, often viscous, substrate at a single point indicate that mixing times are high (greater than ~ 50 seconds even at the 20-m3 scale [Vrabel et al., 1999]). In laboratory-scale bioreactors, where much development work is done, mixing times are low (less than ~ 5 seconds) and such gradients essentially do not exist (Nienow, 1998). The composition of the cells’ microenvironment is a product of both fluid dynamics and the cells’ physiological response to it. Cells circulating around a large-scale bioreactor will undergo rapidly changing microenvironments.
Knowledge of how a cell reacts to such changes is essential if mathematical models are to be derived that can accurately predict process times and product yields on scale-up.
Large-scale studies are difficult and expensive to carry out. In addition, when the results differ from those of bench scale, they are often difficult to interpret. Therefore, equipment and techniques that allow large-scale studies to be simulated at the small scale have become important research tools (see Larsson [1990] for a comprehensive review).
For simulating the phenomenon of poor mixing, one technique used is to divide the large-scale reactor into two compartments (George et al., 1993). The conditions established in each compartment depend on the type of poor mixing situation at the large scale that is to be simulated. For fed-batch fermentations, these two compartments can represent an addition zone where the most severe nutrient concentration gradients exist and the bulk region where the system can be considered to be essentially well mixed. The latter is therefore at a much lower concentration with respect to the nutrient feed. The relative size of the addition zone in the simulation should be of the order of the size of the region in which higher concentrations of substrate exist at the large scale.
The size of this region may be estimated by intuition, flow visualization (again on the small scale), or computational fluid dynamics. Typically, in the small-scale simulation, the addition zone is represented by a plug-flow reactor (PFR), and the bulk region by a stirred-tank reactor (STR) (Larsson, 1990). The volumetric ratio between these two reactors is equal to the estimated ratio of the addition zone to the bulk region in the large-scale reactor (Fig. 1).
Studies Related to the Scale-Up of High-Cell-Density E. coli Fed-Batch Fermentations Using Multiparameter Flow Cytometry: Effect of a Changing
Microenvironment with Respect to Glucose and Dissolved Oxygen Concentration
Christopher J. Hewitt, Gerhard Nebe-Von Caron, Britta Axelsson, Caroline M. McFarlane, Alvin W. Nienow
BIOTECHNOLOGY AND BIOENGINEERING, VOL. 70, NO. 4, NOVEMBER 20, 2000, page 381
Microenvironment with Respect to Glucose and Dissolved Oxygen Concentration
Christopher J. Hewitt, Gerhard Nebe-Von Caron, Britta Axelsson, Caroline M. McFarlane, Alvin W. Nienow
BIOTECHNOLOGY AND BIOENGINEERING, VOL. 70, NO. 4, NOVEMBER 20, 2000, page 381
Questions to answer:
A. What is overflow metabolism, and what problems does it cause in attempts to grow E. coli to high cell densities in a manufacturing reactor?
B. What is a STR?
C. What is a PFR?
D. What is an addition zone?

